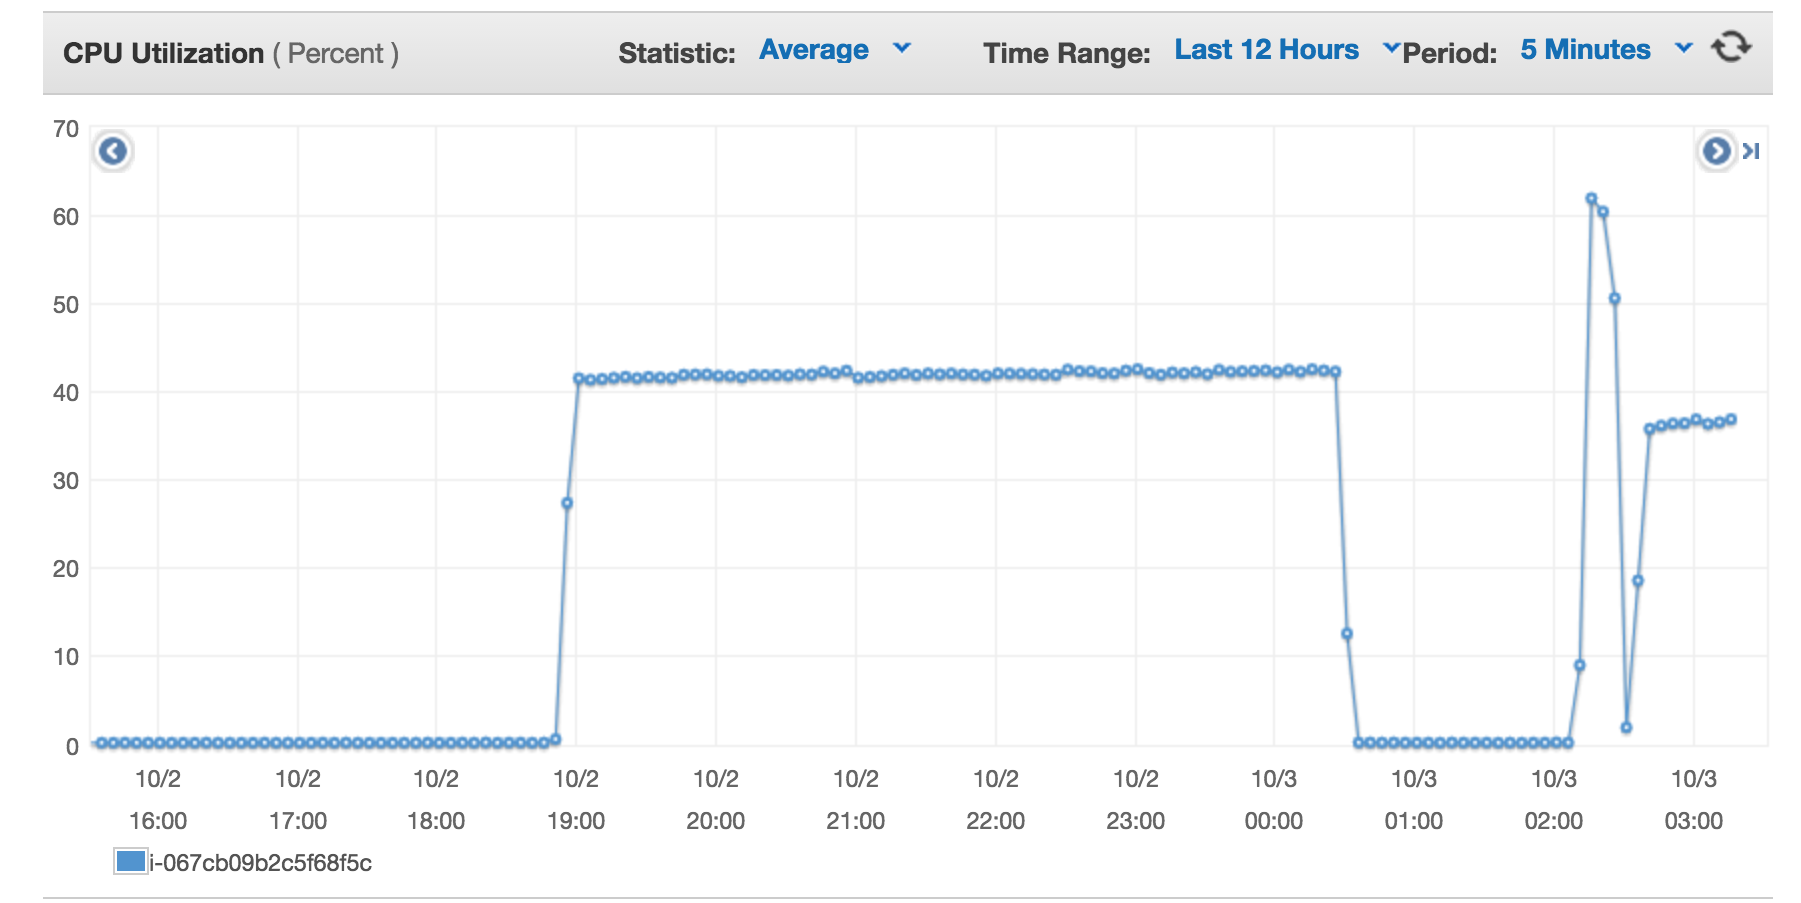
Hi all, I'm testing Freeswitch using ESL interface, recording and SIP UDP Calls at a rate of around 5 CPS. Freeswitch receives ESL requests and proceeds to send call to PSTN Emulator, once call is answered I start recording. I have noticed around 40% CPU utilization when recording is not enabled and ~60%+ CPU when recording is. I created/mount a volume specifically to store the recording files. (ext4) *Server specifications:* EC2 server (t2.medium) 2 vCPUs, 2.5 GHz, Intel Xeon Family, 4 GiB memory. FreeSWITCH (Version 1.6.9 -16-d574870 64bit) I followed instructions at: https://wiki.freeswitch.org/wiki/Performance_testing_and_configurations *[Questions]* a) How to strip down Freeswitch and remove non-used modules? Features I need: *esl, recording, loopback, bridge, sip, spandsp, cdr_csv.* My modules: *fs_cli -x "show modules"* http://pastebin.com/BQSxzFDE b) I would like to see which module is using X/Y amount of CPU cycles/memory in Freeswitch is it possible?. *fs_cli -x 'show status'* UP 0 years, 0 days, 1 hour, 2 minutes, 15 seconds, 541 milliseconds, 286 microseconds FreeSWITCH (Version 1.6.9 -16-d574870 64bit) is ready 18192 session(s) since startup 90 session(s) - peak 93, last 5min 92 5 session(s) per Sec out of max 30, peak 7, last 5min 6 1000 session(s) max min idle cpu 0.00/75.57 Current Stack Size/Max 240K/8192K A sample image is below: 40% steady (no recording) a peak when I enabled recording. [image: Inline image 1] # top top - 03:25:16 up 22:42, 1 user, load average: 3.88, 5.74, 10.39 Tasks:* 68 *total,* 1 *running,* 67 *sleeping,* 0 *stopped,* 0 * zombie %Cpu(s):* 11.0 *us,* 2.3 *sy,* 0.0 *ni,* 85.7 *id,* 0.0 *wa,* 0.0 *hi,* 0.7 *si,* 0.4 *st KiB Mem: * 4057584 *total,* 865964 *used,* 3191620 *free,* 147088 * buffers KiB Swap:* 1048572 *total,* 0 *used,* 1048572 *free.* 213572 *cached Mem PID USER PR NI VIRT RES SHR S %CPU %MEM TIME+ COMMAND 26217 freeswi+ -2 -10 1427444 302584 16904 S *65.9* 7.5 28:47.49 freeswitch