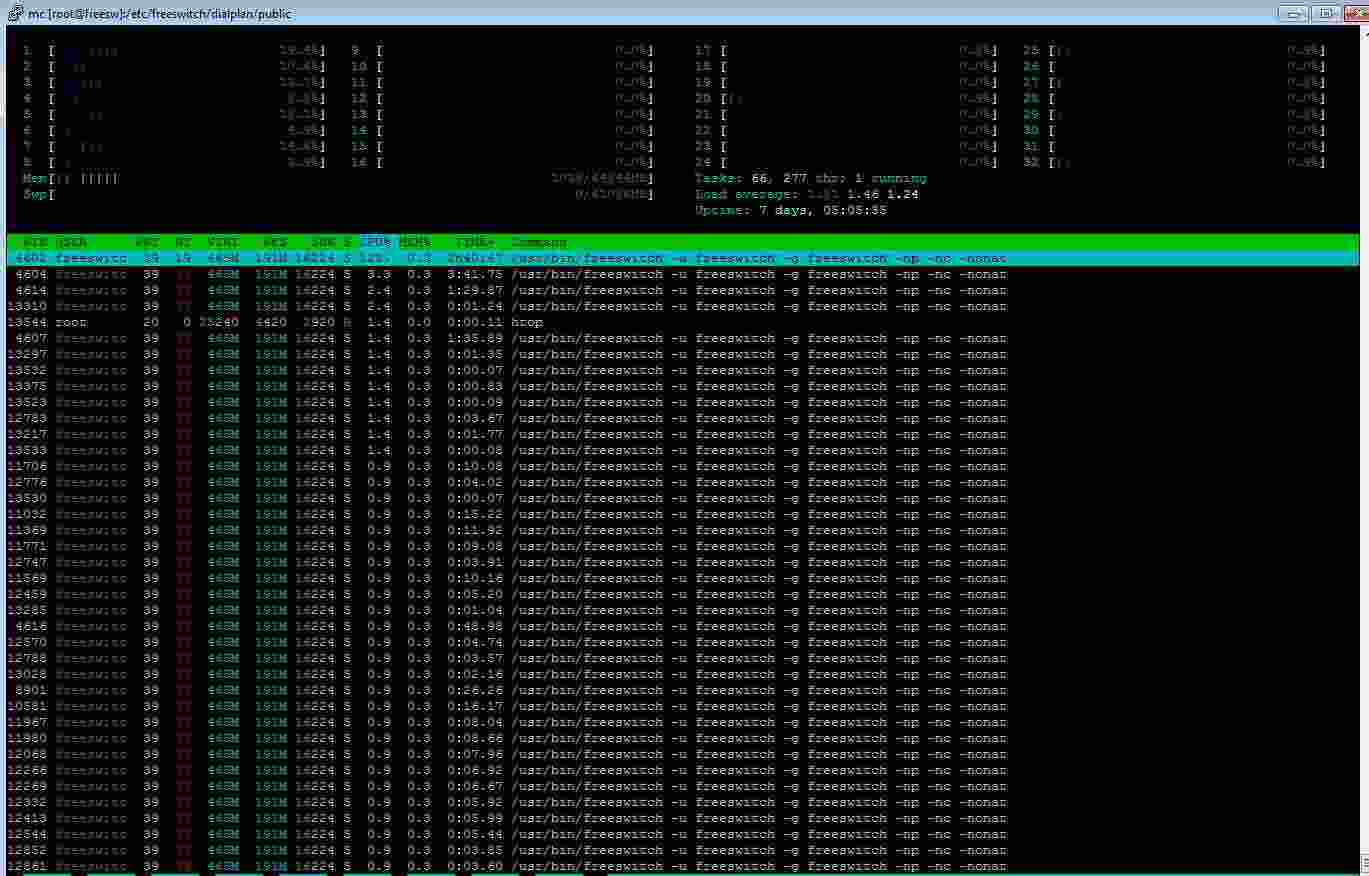
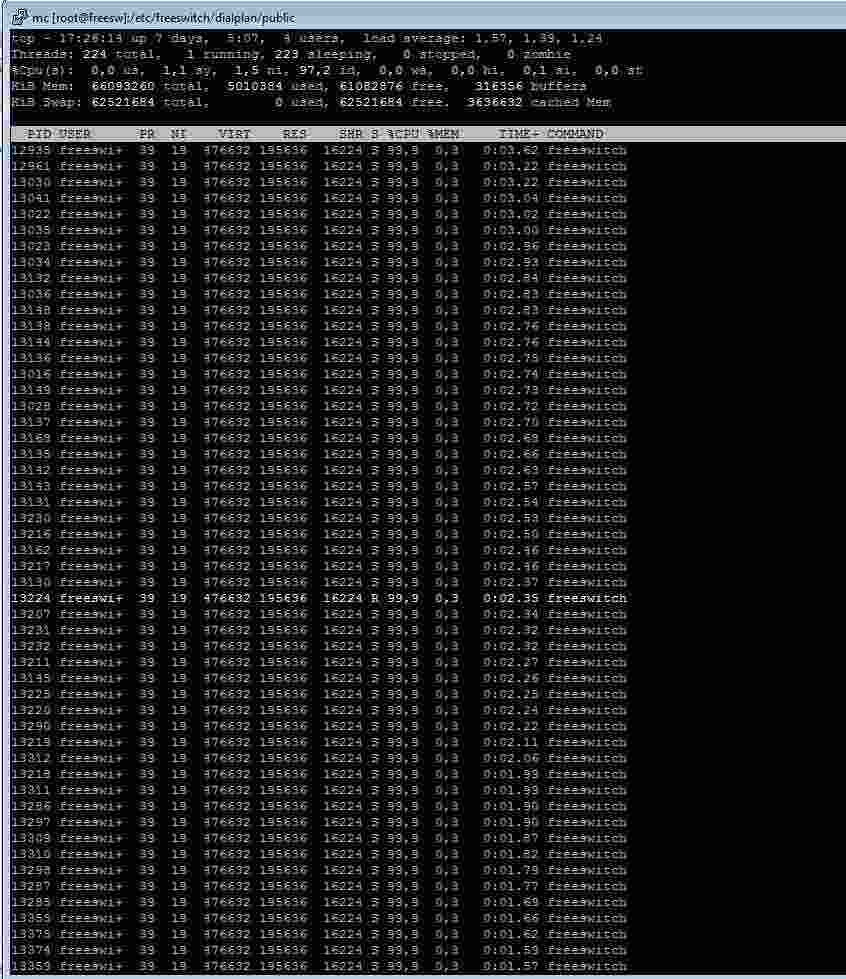
in the attachment pics output top -p <fs pid> -H and htop 29.09.2016 17:12, Ken Rice пишет:
Better to just use htop and you can not only see that but pretty graphs heh
-----Original Message----- From: freeswitch-users-bounces@lists.freeswitch.org [mailto:freeswitch-users-bounces@lists.freeswitch.org] On Behalf Of Kevin Wormington Sent: Thursday, September 29, 2016 8:59 AM To: FreeSWITCH Users Help <freeswitch-users@lists.freeswitch.org> Subject: Re: [Freeswitch-users] Debian8 FS-1.6.10 simple bridging and high CPU load
If you press ‘1’ while in top it should display the usage of individual CPUs so you can see Ken’s point.
On Sep 29, 2016, at 7:03 AM, Ken Rice <krice@freeswitch.org> wrote:
Keep in mind that top showing 125% is VERY misleading... lets say you have a 10 core system for the sake of example, 125% in top means you are using roughly 12.5% of the total CPU Power of your system. This is because TOP takes the individual core percentages and adds them up...
-----Original Message----- From: freeswitch-users-bounces@lists.freeswitch.org [mailto:freeswitch-users-bounces@lists.freeswitch.org] On Behalf Of Mikhail Demekhov Sent: Thursday, September 29, 2016 1:50 AM To: freeswitch-users@lists.freeswitch.org Subject: [Freeswitch-users] Debian8 FS-1.6.10 simple bridging and high CPU load
Hello!
I have installed freeswitch using apt-get on my debian 8 sersver from https://freeswitch.org/confluence/display/FREESWITCH/Debian+8+Jessie block under title 'latest release branch:'
My server hardware: 2xCPU AMD Opteron(tm) Processor 6262 HE 64 GB RAM
I'm using calls with bridging from voipgw1(2,3) to gw4(5,6), G711A on both leg A and leg B core.db in TMPFS
Through my server takes about 125 simultaneous calls
CPU load about 125%! It is very high in my opinion.
How to fix it?