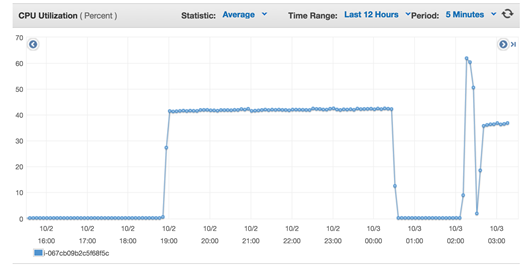
How are you actually recording the files? Native? mp3? wav? Something else? keep in mind that recording also means disk io which means more CPU while its recording to handle the IO load… there are way too many undisclosed factors here that can and will impact your performance… one example is 2 cores? That’s all? FS is a highly threaded application… that means for each call leg there is atleast 1 thread… so the more cores the merrier… not to mention you are running on amazon that leaves a whole different set of variables to attend too…. From: freeswitch-users-bounces@lists.freeswitch.org [mailto:freeswitch-users-bounces@lists.freeswitch.org] On Behalf Of Gonzalo Gasca Meza Sent: Sunday, October 2, 2016 10:43 PM To: FreeSWITCH Users Help <freeswitch-users@lists.freeswitch.org> Subject: [Freeswitch-users] Performance testing Hi all, I'm testing Freeswitch using ESL interface, recording and SIP UDP Calls at a rate of around 5 CPS. Freeswitch receives ESL requests and proceeds to send call to PSTN Emulator, once call is answered I start recording. I have noticed around 40% CPU utilization when recording is not enabled and ~60%+ CPU when recording is. I created/mount a volume specifically to store the recording files. (ext4) Server specifications: EC2 server (t2.medium) 2 vCPUs, 2.5 GHz, Intel Xeon Family, 4 GiB memory. FreeSWITCH (Version 1.6.9 -16-d574870 64bit) I followed instructions at: https://wiki.freeswitch.org/wiki/Performance_testing_and_configurations [Questions] a) How to strip down Freeswitch and remove non-used modules? Features I need: esl, recording, loopback, bridge, sip, spandsp, cdr_csv. My modules: fs_cli -x "show modules" http://pastebin.com/BQSxzFDE b) I would like to see which module is using X/Y amount of CPU cycles/memory in Freeswitch is it possible?. fs_cli -x 'show status' UP 0 years, 0 days, 1 hour, 2 minutes, 15 seconds, 541 milliseconds, 286 microseconds FreeSWITCH (Version 1.6.9 -16-d574870 64bit) is ready 18192 session(s) since startup 90 session(s) - peak 93, last 5min 92 5 session(s) per Sec out of max 30, peak 7, last 5min 6 1000 session(s) max min idle cpu 0.00/75.57 Current Stack Size/Max 240K/8192K A sample image is below: 40% steady (no recording) a peak when I enabled recording. # top top - 03:25:16 up 22:42, 1 user, load average: 3.88, 5.74, 10.39 Tasks: 68 total, 1 running, 67 sleeping, 0 stopped, 0 zombie %Cpu(s): 11.0 us, 2.3 sy, 0.0 ni, 85.7 id, 0.0 wa, 0.0 hi, 0.7 si, 0.4 st KiB Mem: 4057584 total, 865964 used, 3191620 free, 147088 buffers KiB Swap: 1048572 total, 0 used, 1048572 free. 213572 cached Mem PID USER PR NI VIRT RES SHR S %CPU %MEM TIME+ COMMAND 26217 freeswi+ -2 -10 1427444 302584 16904 S 65.9 7.5 28:47.49 freeswitch