Keep in mind that top showing 125% is VERY misleading... lets say you have a 10 core system for the sake of example, 125% in top means you are using roughly 12.5% of the total CPU Power of your system. This is because TOP takes the individual core percentages and adds them up...
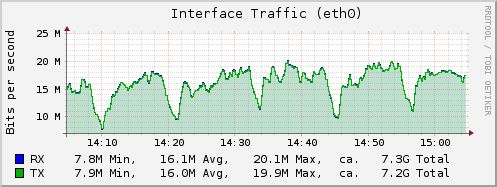
I see. I would not have noticed it if not for two problems. When I want to use FS with registration will on another server, the registration works properly only when my FS is in idle mode. When the CPU load on the FS is increased to 70-100%, the registration is lost and not recovered (State FAIL_WAIT). In addition, there is a strange load on Etnernet. Every 10 minutes, the traffic fails. The number of calls is not changed. I have attached a picture.
-----Original Message----- From: freeswitch-users-bounces@lists.freeswitch.org [mailto:freeswitch-users-bounces@lists.freeswitch.org] On Behalf Of Mikhail Demekhov Sent: Thursday, September 29, 2016 1:50 AM To: freeswitch-users@lists.freeswitch.org Subject: [Freeswitch-users] Debian8 FS-1.6.10 simple bridging and high CPU load
Hello!
I have installed freeswitch using apt-get on my debian 8 sersver from https://freeswitch.org/confluence/display/FREESWITCH/Debian+8+Jessie block under title 'latest release branch:'
My server hardware: 2xCPU AMD Opteron(tm) Processor 6262 HE 64 GB RAM
I'm using calls with bridging from voipgw1(2,3) to gw4(5,6), G711A on both leg A and leg B core.db in TMPFS
Through my server takes about 125 simultaneous calls
CPU load about 125%! It is very high in my opinion.
How to fix it?
top PID USER PR NI VIRT RES SHR S %CPU %MEM TIME+ COMMAND 13587 freeswi+ 39 19 485252 200020 16284 S 110,1 0,3 3062:38 freeswitch