Jitter and dropping MOS score
Hi all, we are currently experiencing jitter and dropping MOS score on an increasing amount of calls on our system. i can't see any increased load on our system (neither CPU nor I/O wise). Current stats: ~ 15Mbit/s network traffic (on a 1Gbit/s network) load average: 1,10, 0,82, 0,91 (16 core machine) memory used: 2,26GB/16GB freeswitch@lc1> status UP 0 years, 12 days, 13 hours, 30 minutes, 24 seconds, 649 milliseconds, 831 microseconds FreeSWITCH (Version 1.10.1 -release-12-f9990221e6 64bit) is ready 137634 session(s) since startup 218 session(s) - peak 245, last 5min 222 1 session(s) per Sec out of max 30, peak 8, last 5min 2 1000 session(s) max min idle cpu 0.00/95.37 Current Stack Size/Max 244K/244K System ist not virtualized. the only "strange" thing i see is the freeswitch "main"process that consumes (according to htop) >=100% cpu (see attached screenshot). Can this be the problem? if yes what can i do against it. if not what are possible bottlenecks i should weed out? if you need any additional informations to help me sort out this problem please don't hesitate to ask. Thanks in advance and best regards Christoph -- ________________________________________________________________ EMTEX GmbH Christoph Russow Software Engineer Bischof-Otto-Weg 9 D-91086 Aurachtal Geschäftsführer: Markus Enzinger Tel. +49 9132 7490 0 Sitz der Gesellschaft: 91086 Aurachtal Fax. +49 9132 7490 900 Amtsgericht Fürth: HRB6804 ________________________________________________________________
Christoph, If you are running any lua scripts, you might want to look at those... I had a huge load issue I went through in testing and found out my lua scripts were killing the CPU during "high" usage of 3-5 calls... Search for my postings on "High CPU usage and Slow BLFs with only 8 channels" or... https://lists.freeswitch.org/pipermail/freeswitch-users/2021-September/13506... The issue I had was looking at the EVENTS in the lua script.... Every channel created 20-30 events I changed the strategy for catching the EVENTS and the load has never been over 0.2. The MOS is now steady at 4+ and ZERO jitter.... While I never commented on the jitter in my postings, there were issues and I knew it was due to the high CPU usage. My issue, why the high load with only a few calls. Hope it helps, Jerry On 10/5/2021 5:33 AM, Christoph Russow wrote:
Hi all,
we are currently experiencing jitter and dropping MOS score on an increasing amount of calls on our system.
i can't see any increased load on our system (neither CPU nor I/O wise).
Current stats:
~ 15Mbit/s network traffic (on a 1Gbit/s network) load average: 1,10, 0,82, 0,91 (16 core machine) memory used: 2,26GB/16GB
freeswitch@lc1> status UP 0 years, 12 days, 13 hours, 30 minutes, 24 seconds, 649 milliseconds, 831 microseconds FreeSWITCH (Version 1.10.1 -release-12-f9990221e6 64bit) is ready 137634 session(s) since startup 218 session(s) - peak 245, last 5min 222 1 session(s) per Sec out of max 30, peak 8, last 5min 2 1000 session(s) max min idle cpu 0.00/95.37 Current Stack Size/Max 244K/244K
System ist not virtualized.
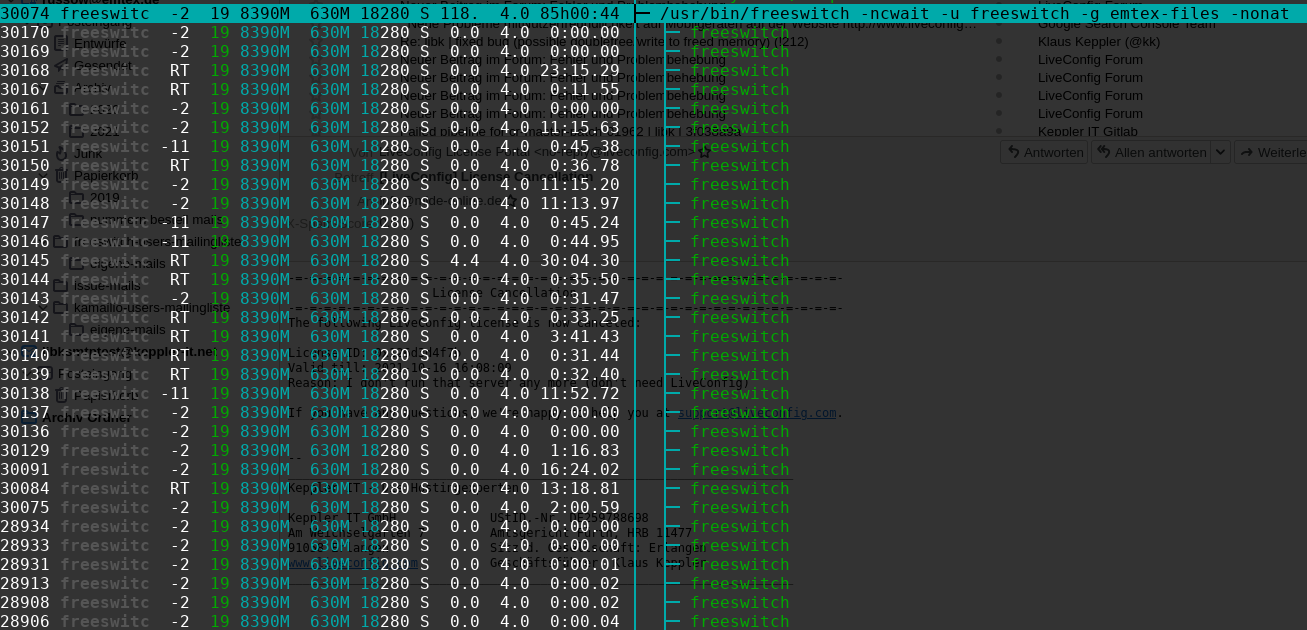
the only "strange" thing i see is the freeswitch "main"process that consumes (according to htop) >=100% cpu (see attached screenshot). Can this be the problem? if yes what can i do against it.
if not what are possible bottlenecks i should weed out?
if you need any additional informations to help me sort out this problem please don't hesitate to ask.
Thanks in advance and best regards Christoph
_________________________________________________________________________
The FreeSWITCH project is sponsored by SignalWire https://signalwire.com Enhance your FreeSWITCH install with disruptive priced SMS and PSTN services. Build your next product on our scalable cloud platform.
Join our online community to chat in real time https://signalwire.community
Professional FreeSWITCH Services sales@freeswitch.com https://freeswitch.com
Official FreeSWITCH Sites https://freeswitch.com/oss https://freeswitch.org/confluence https://cluecon.com
FreeSWITCH-users mailing list FreeSWITCH-users@lists.freeswitch.org http://lists.freeswitch.org/mailman/listinfo/freeswitch-users UNSUBSCRIBE:http://lists.freeswitch.org/mailman/options/freeswitch-users https://freeswitch.com
Hi Christoph, For the CPU part: On linux boxes if a process in top goes over 100% or top shows >1.0 in load, this means that more than one core is occupied. Since you have 16 cores this is fine as you are using 1/16 of your CPU for the FreeSWITCH process. So 200% would be 2 cores fully used etc, etc. For the Jitter part/dropping MoS, we might need a bit more info, like times or patterns that is happens or even what the MoS drops by and how much jitter is seen. I personally use SNGrep and a combination of Homer/VoIPMonitor to get all of the stuff I need. Accurate monitoring will point you in the right direction if there is an issue (Homer 7 is free and really good as a side note) Thanks, John. -----Original Message----- From: Christoph Russow <russow@emtex.de> Sent: 05 October 2021 10:34 To: freeswitch-users@lists.freeswitch.org Subject: [Freeswitch-users] Jitter and dropping MOS score Hi all, we are currently experiencing jitter and dropping MOS score on an increasing amount of calls on our system. i can't see any increased load on our system (neither CPU nor I/O wise). Current stats: ~ 15Mbit/s network traffic (on a 1Gbit/s network) load average: 1,10, 0,82, 0,91 (16 core machine) memory used: 2,26GB/16GB freeswitch@lc1> status UP 0 years, 12 days, 13 hours, 30 minutes, 24 seconds, 649 milliseconds, 831 microseconds FreeSWITCH (Version 1.10.1 -release-12-f9990221e6 64bit) is ready 137634 session(s) since startup 218 session(s) - peak 245, last 5min 222 1 session(s) per Sec out of max 30, peak 8, last 5min 2 1000 session(s) max min idle cpu 0.00/95.37 Current Stack Size/Max 244K/244K System ist not virtualized. the only "strange" thing i see is the freeswitch "main"process that consumes (according to htop) >=100% cpu (see attached screenshot). Can this be the problem? if yes what can i do against it. if not what are possible bottlenecks i should weed out? if you need any additional informations to help me sort out this problem please don't hesitate to ask. Thanks in advance and best regards Christoph -- ________________________________________________________________ EMTEX GmbH Christoph Russow Software Engineer Bischof-Otto-Weg 9 D-91086 Aurachtal Geschäftsführer: Markus Enzinger Tel. +49 9132 7490 0 Sitz der Gesellschaft: 91086 Aurachtal Fax. +49 9132 7490 900 Amtsgericht Fürth: HRB6804 ________________________________________________________________
Hi, I can not tell you about everybody, but usually when I get this problem 99% of the time the issue is on the provider side. I would try to reproduce this issue by myself and capture pcap files and analyze those. With kind regards, Jurijs On Wed, Oct 6, 2021 at 7:43 PM John Hardiman < john.hardiman@missionlabs.co.uk> wrote:
Hi Christoph,
For the CPU part: On linux boxes if a process in top goes over 100% or top shows >1.0 in load, this means that more than one core is occupied. Since you have 16 cores this is fine as you are using 1/16 of your CPU for the FreeSWITCH process. So 200% would be 2 cores fully used etc, etc.
For the Jitter part/dropping MoS, we might need a bit more info, like times or patterns that is happens or even what the MoS drops by and how much jitter is seen. I personally use SNGrep and a combination of Homer/VoIPMonitor to get all of the stuff I need.
Accurate monitoring will point you in the right direction if there is an issue (Homer 7 is free and really good as a side note)
Thanks,
John.
-----Original Message----- From: Christoph Russow <russow@emtex.de> Sent: 05 October 2021 10:34 To: freeswitch-users@lists.freeswitch.org Subject: [Freeswitch-users] Jitter and dropping MOS score
Hi all,
we are currently experiencing jitter and dropping MOS score on an increasing amount of calls on our system.
i can't see any increased load on our system (neither CPU nor I/O wise).
Current stats:
~ 15Mbit/s network traffic (on a 1Gbit/s network) load average: 1,10, 0,82, 0,91 (16 core machine) memory used: 2,26GB/16GB
freeswitch@lc1> status UP 0 years, 12 days, 13 hours, 30 minutes, 24 seconds, 649 milliseconds, 831 microseconds FreeSWITCH (Version 1.10.1 -release-12-f9990221e6 64bit) is ready 137634 session(s) since startup 218 session(s) - peak 245, last 5min 222 1 session(s) per Sec out of max 30, peak 8, last 5min 2 1000 session(s) max min idle cpu 0.00/95.37 Current Stack Size/Max 244K/244K
System ist not virtualized.
the only "strange" thing i see is the freeswitch "main"process that consumes (according to htop) >=100% cpu (see attached screenshot). Can this be the problem? if yes what can i do against it.
if not what are possible bottlenecks i should weed out?
if you need any additional informations to help me sort out this problem please don't hesitate to ask.
Thanks in advance and best regards Christoph
-- ________________________________________________________________
EMTEX GmbH Christoph Russow Software Engineer
Bischof-Otto-Weg 9 D-91086 Aurachtal Geschäftsführer: Markus Enzinger Tel. +49 9132 7490 0 Sitz der Gesellschaft: 91086 Aurachtal Fax. +49 9132 7490 900 Amtsgericht Fürth: HRB6804 ________________________________________________________________ _________________________________________________________________________
The FreeSWITCH project is sponsored by SignalWire https://signalwire.com Enhance your FreeSWITCH install with disruptive priced SMS and PSTN services. Build your next product on our scalable cloud platform.
Join our online community to chat in real time https://signalwire.community
Professional FreeSWITCH Services sales@freeswitch.com https://freeswitch.com
Official FreeSWITCH Sites https://freeswitch.com/oss https://freeswitch.org/confluence https://cluecon.com
FreeSWITCH-users mailing list FreeSWITCH-users@lists.freeswitch.org http://lists.freeswitch.org/mailman/listinfo/freeswitch-users UNSUBSCRIBE:http://lists.freeswitch.org/mailman/options/freeswitch-users https://freeswitch.com
if it really consumes 100% CPU with few calls then it's abnormal. kill it with SIGABRT (make sure it will dump core before that), get a backtrace with gdb and open a github issue. before doing this you need to make sure it's really eating 100 % CPU, this screenshot is not very relevant. Also, you need to make sure you don't have real packet loss. Perhaps it's a matter of dimensioning, eg: how many simultaneous calls do you expect to have on that hardware, what codec, etc. On Wed, Oct 6, 2021 at 2:26 AM Christoph Russow <russow@emtex.de> wrote:
Hi all,
we are currently experiencing jitter and dropping MOS score on an increasing amount of calls on our system.
i can't see any increased load on our system (neither CPU nor I/O wise).
Current stats:
~ 15Mbit/s network traffic (on a 1Gbit/s network) load average: 1,10, 0,82, 0,91 (16 core machine) memory used: 2,26GB/16GB
freeswitch@lc1> status UP 0 years, 12 days, 13 hours, 30 minutes, 24 seconds, 649 milliseconds, 831 microseconds FreeSWITCH (Version 1.10.1 -release-12-f9990221e6 64bit) is ready 137634 session(s) since startup 218 session(s) - peak 245, last 5min 222 1 session(s) per Sec out of max 30, peak 8, last 5min 2 1000 session(s) max min idle cpu 0.00/95.37 Current Stack Size/Max 244K/244K
System ist not virtualized.
the only "strange" thing i see is the freeswitch "main"process that consumes (according to htop) >=100% cpu (see attached screenshot). Can this be the problem? if yes what can i do against it.
if not what are possible bottlenecks i should weed out?
if you need any additional informations to help me sort out this problem please don't hesitate to ask.
Thanks in advance and best regards Christoph
-- ________________________________________________________________
EMTEX GmbH Christoph Russow Software Engineer
Bischof-Otto-Weg 9 D-91086 Aurachtal Geschäftsführer: Markus Enzinger Tel. +49 9132 7490 0 Sitz der Gesellschaft: 91086 Aurachtal Fax. +49 9132 7490 900 Amtsgericht Fürth: HRB6804
_________________________________________________________________________________________________________________________________________
The FreeSWITCH project is sponsored by SignalWire https://signalwire.com Enhance your FreeSWITCH install with disruptive priced SMS and PSTN services. Build your next product on our scalable cloud platform.
Join our online community to chat in real time https://signalwire.community
Professional FreeSWITCH Services sales@freeswitch.com https://freeswitch.com
Official FreeSWITCH Sites https://freeswitch.com/oss https://freeswitch.org/confluence https://cluecon.com
FreeSWITCH-users mailing list FreeSWITCH-users@lists.freeswitch.org http://lists.freeswitch.org/mailman/listinfo/freeswitch-users UNSUBSCRIBE:http://lists.freeswitch.org/mailman/options/freeswitch-users https://freeswitch.com
Hi all, thanks for all the input. We could sort out the Jitter/MOS problem as a temporary Network problem with one of our carriers. about the CPU: how should i make sure that it is really eating 100% CPU? "ps aux" shows the freeswitch process at arround 30% so it seems to not really consume 100%cpu as htop still tells me. USER PID %CPU %MEM VSZ RSS TTY STAT START TIME COMMAND freeswi+ 30074 30.6 3.9 8582604 636456 ? SNsl Sep22 6431:58 /usr/bin/freeswitch -ncwait -u freeswitch -g emtex-files -nonat best regards Christoph Am 06.10.21 um 12:33 schrieb Dragos Oancea:
if it really consumes 100% CPU with few calls then it's abnormal. kill it with SIGABRT (make sure it will dump core before that), get a backtrace with gdb and open a github issue. before doing this you need to make sure it's really eating 100 % CPU, this screenshot is not very relevant. Also, you need to make sure you don't have real packet loss. Perhaps it's a matter of dimensioning, eg: how many simultaneous calls do you expect to have on that hardware, what codec, etc.
On Wed, Oct 6, 2021 at 2:26 AM Christoph Russow <russow@emtex.de <mailto:russow@emtex.de>> wrote:
Hi all,
we are currently experiencing jitter and dropping MOS score on an increasing amount of calls on our system.
i can't see any increased load on our system (neither CPU nor I/O wise).
Current stats:
~ 15Mbit/s network traffic (on a 1Gbit/s network) load average: 1,10, 0,82, 0,91 (16 core machine) memory used: 2,26GB/16GB
freeswitch@lc1> status UP 0 years, 12 days, 13 hours, 30 minutes, 24 seconds, 649 milliseconds, 831 microseconds FreeSWITCH (Version 1.10.1 -release-12-f9990221e6 64bit) is ready 137634 session(s) since startup 218 session(s) - peak 245, last 5min 222 1 session(s) per Sec out of max 30, peak 8, last 5min 2 1000 session(s) max min idle cpu 0.00/95.37 Current Stack Size/Max 244K/244K
System ist not virtualized.
the only "strange" thing i see is the freeswitch "main"process that consumes (according to htop) >=100% cpu (see attached screenshot). Can this be the problem? if yes what can i do against it.
if not what are possible bottlenecks i should weed out?
if you need any additional informations to help me sort out this problem please don't hesitate to ask.
Thanks in advance and best regards Christoph
-- ________________________________________________________________
EMTEX GmbH Christoph Russow Software Engineer
Bischof-Otto-Weg 9 D-91086 Aurachtal Geschäftsführer: Markus Enzinger Tel. +49 9132 7490 0 Sitz der Gesellschaft: 91086 Aurachtal Fax. +49 9132 7490 900 Amtsgericht Fürth: HRB6804 _________________________________________________________________________________________________________________________________________
The FreeSWITCH project is sponsored by SignalWire https://signalwire.com <https://signalwire.com> Enhance your FreeSWITCH install with disruptive priced SMS and PSTN services. Build your next product on our scalable cloud platform.
Join our online community to chat in real time https://signalwire.community <https://signalwire.community>
Professional FreeSWITCH Services sales@freeswitch.com <mailto:sales@freeswitch.com> https://freeswitch.com <https://freeswitch.com>
Official FreeSWITCH Sites https://freeswitch.com/oss <https://freeswitch.com/oss> https://freeswitch.org/confluence <https://freeswitch.org/confluence> https://cluecon.com <https://cluecon.com>
FreeSWITCH-users mailing list FreeSWITCH-users@lists.freeswitch.org <mailto:FreeSWITCH-users@lists.freeswitch.org> http://lists.freeswitch.org/mailman/listinfo/freeswitch-users <http://lists.freeswitch.org/mailman/listinfo/freeswitch-users> UNSUBSCRIBE:http://lists.freeswitch.org/mailman/options/freeswitch-users <http://lists.freeswitch.org/mailman/options/freeswitch-users> https://freeswitch.com <https://freeswitch.com>
_________________________________________________________________________
The FreeSWITCH project is sponsored by SignalWire https://signalwire.com Enhance your FreeSWITCH install with disruptive priced SMS and PSTN services. Build your next product on our scalable cloud platform.
Join our online community to chat in real time https://signalwire.community
Professional FreeSWITCH Services sales@freeswitch.com https://freeswitch.com
Official FreeSWITCH Sites https://freeswitch.com/oss https://freeswitch.org/confluence https://cluecon.com
FreeSWITCH-users mailing list FreeSWITCH-users@lists.freeswitch.org http://lists.freeswitch.org/mailman/listinfo/freeswitch-users UNSUBSCRIBE:http://lists.freeswitch.org/mailman/options/freeswitch-users https://freeswitch.com
First thing to look at is check your lua scripts if you have any. It is very strange for fs to take 100% of cpu on such low loads. So check your call flows. On Wed, 6 Oct 2021 at 00:58, Christoph Russow <russow@emtex.de> wrote:
Hi all,
we are currently experiencing jitter and dropping MOS score on an increasing amount of calls on our system.
i can't see any increased load on our system (neither CPU nor I/O wise).
Current stats:
~ 15Mbit/s network traffic (on a 1Gbit/s network) load average: 1,10, 0,82, 0,91 (16 core machine) memory used: 2,26GB/16GB
freeswitch@lc1> status UP 0 years, 12 days, 13 hours, 30 minutes, 24 seconds, 649 milliseconds, 831 microseconds FreeSWITCH (Version 1.10.1 -release-12-f9990221e6 64bit) is ready 137634 session(s) since startup 218 session(s) - peak 245, last 5min 222 1 session(s) per Sec out of max 30, peak 8, last 5min 2 1000 session(s) max min idle cpu 0.00/95.37 Current Stack Size/Max 244K/244K
System ist not virtualized.
the only "strange" thing i see is the freeswitch "main"process that consumes (according to htop) >=100% cpu (see attached screenshot). Can this be the problem? if yes what can i do against it.
if not what are possible bottlenecks i should weed out?
if you need any additional informations to help me sort out this problem please don't hesitate to ask.
Thanks in advance and best regards Christoph
-- ________________________________________________________________
EMTEX GmbH Christoph Russow Software Engineer
Bischof-Otto-Weg 9 D-91086 Aurachtal Geschäftsführer: Markus Enzinger Tel. +49 9132 7490 0 Sitz der Gesellschaft: 91086 Aurachtal Fax. +49 9132 7490 900 Amtsgericht Fürth: HRB6804
_________________________________________________________________________________________________________________________________________
The FreeSWITCH project is sponsored by SignalWire https://signalwire.com Enhance your FreeSWITCH install with disruptive priced SMS and PSTN services. Build your next product on our scalable cloud platform.
Join our online community to chat in real time https://signalwire.community
Professional FreeSWITCH Services sales@freeswitch.com https://freeswitch.com
Official FreeSWITCH Sites https://freeswitch.com/oss https://freeswitch.org/confluence https://cluecon.com
FreeSWITCH-users mailing list FreeSWITCH-users@lists.freeswitch.org http://lists.freeswitch.org/mailman/listinfo/freeswitch-users UNSUBSCRIBE:http://lists.freeswitch.org/mailman/options/freeswitch-users https://freeswitch.com
-- Regards, David Villasmil email: david.villasmil.work@gmail.com phone: +34669448337
participants (6)
-
Christoph Russow
-
David Villasmil
-
Dragos Oancea
-
Jerry Kendall
-
John Hardiman
-
Jurijs Ivolga